

I’ve encountered a lot of confusion about the difference between Metrics, Key Performance Indicators (KPIs), and Critical Success Factors (CSFs) so let’s talk about that.*
First let me just say that Metrics unto themselves are useless.

This is a Metric. Isn’t it lovely? Just a dot on a graph. Of course it has a value associated with it, but as far as the information it is providing, it is meaningless.
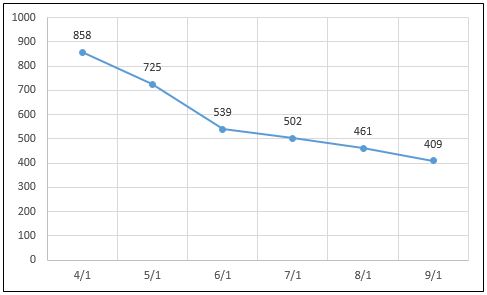
Here are bunch of metrics. If you connect them together you can see that something’s changing, but what is changing and whether or not it is important? Who knows.
Let’s put some context around these dots.
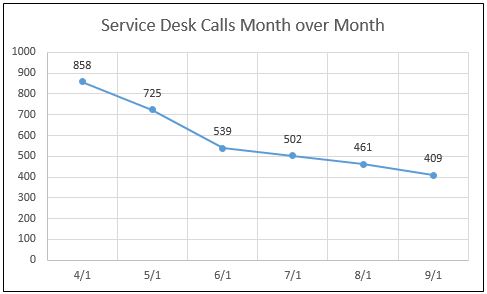
Now we have something that has meaning. It looks like the number of calls to the Service Desk has been decreasing over the last seven months. Is that good? Is that bad? We don’t know. Maybe management just spent big bucks upgrading the Service Desk’s capabilities and implemented a Communication Plan to encourage users to call the Service Desk. In which case this graph is showing failure. Maybe management just implemented a self-service portal and is looking for a reduction in Service Desk calls. In which case this graph (along with an associated increase in the self-service portal hits) is showing success. Again, we just don’t know.
This is because all we have are Metrics, and Metrics without a goal are meaningless.
So what is a goal? The goal is the Critical Success Factor or CSF. The CSF defines success. Take the case where management has just implemented new Service Desk capabilities and is actively pushing for users to reach out to the Service Desk. Whether or not this goal is being achieved can partially be represented by an increase in the volume of calls made to the Service Desk.
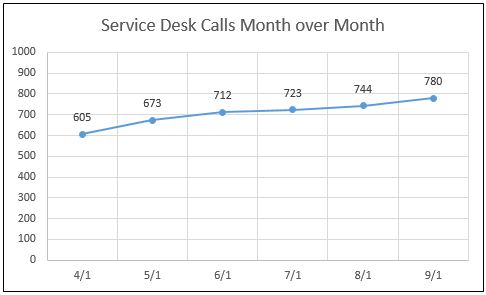
So here is a graph showing that the call volume to the Service Desk has steadily been increasing over the last 6 months. This corresponds with the project to improve the Service Desk capabilities and drive volume to the desk.
So at what point do we know if we were successful? Well, in keeping with the Deming Cycle of Continuous Improvement, we should have defined success prior to implementing the Service Desk improvement project.
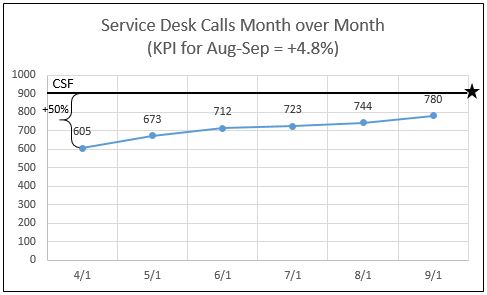
We will say that one definition of success is a 50% increase in Service Desk call volumes. That goal is a Critical Success Factor.
Our measurement either towards or away from that goal is the Key Performance Indicator for that Critical Success Factor. The KPIs aren’t the data points on the graph, they are the lines connecting the data points (and more specifically, the angle of the lines). KPIs are the measurement of change over time. A KPI that doesn’t reference a timeframe for the change is meaningless.
It should also be noted that this is a Performance KPI and needs to be balanced with other KPIs to ensure you aren’t reinforcing bad behaviors.
I started this article talking about Metrics and then moved on to KPIs and CSFs, but truthfully you should go about the measurement process in a very different order. Per the Deming Cycle of Continuous Improvement Model, you should first define what success looks like (the CSF). Then determine what you can measure that will support your definition of success (the Metrics). Then come up with a reasonable timeframe to achieve success and how much improvement period-over-period to show progress towards the goal (the KPIs). I would suggest having 3 or 4 CSFs and their associated KPIs to show that a project has achieved its goals.
If I were to implement a Service Desk improvement project, I would like to see these CSFs with balanced KPIs to support them.
Project: Improve Service Desk capabilities and increase Service Desk utilization from organization’s users.
| CSF | KPI Type | KPI |
| Increase call volume to the Service Desk by 50% in 12 months. | Performance | Achieve an average increase in call volume to the Service Desk of 4.2% month-over-month. |
| Reduce walk-up calls made to 2nd Level technicians’ desks by 50% in 12 months. | Cost | Reduce tickets logged directly by 2nd Level technicians on behalf of end users by an average of 4.2% month-over-month. |
| Increase first call resolution rate at the Service Desk by 30% in 12 months. | Quality | Volume of tickets created by Service Desk and resolved without escalation reduced 2.5% month-over-month. |
| Improvement of customer satisfaction survey rating on “How quickly was the issue resolved?” 1 full point over the course of 12 months for issues resolved at the Service Desk. | Quality | CSS result of “How quickly was the issue resolved?” have an average .083 improvement month-over-month for calls resolved by the Service Desk. |
Don’t fall into the trap of knowing what you can measure and then coming up with how you can shoehorn those measurements into a story of how they support an arbitrary definition of success. This is a very seductive technique that vendors use to sell their tools: “You can measure this metric, so in measuring this metric, you can prove that you have succeeded in some (arbitrary) goal”. Tell the vendor your goal and then ask them how the metrics produced by their tool can be used to support that goal.
* Apologies to Good Mythical Morning for appropriating their tagline.
Pingback: Process Engineering in a Nutshell | ITILtopia