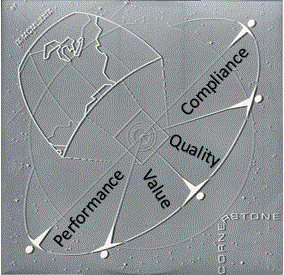
 When I took my ITIL v2 Manager’s course with Pink Elephant, one of the most interesting sessions we had was about the four categories of Key Performance Indicators (KPIs) and how they must be balanced. The KPI categories are similar in concept to Kaplan and Nolan’s Balanced Scorecard. In the class we discussed the four competing quadrants of KPI metrics and some of the common pitfalls in developing them.
Categories
The four KPIs categories are:
- Performance – How fast? How many?
- Quality – How well?
- Compliance – Did we follow the rules?
- Value – Show me the money!
Performance
Performance is the metric that most IT KPIs focus on. This makes sense since reports produced by most of our tools are performance focused. For example:
- Calls taken per analyst/hour
- Application response time
- Incident time to resolution
- Service Requests fulfilled per month
- Changes approved per CAB
The list goes on and on. Because this is the focus of most (if not all) of our reporting, Performance KPIs have become the backbone of our window into how IT is functioning. This is unfortunate, because with such a large focus on Performance, we lose focus on the three other quadrants.
Quality
Quality KPIs should show how well are we doing something. Quality and Performance are the most obvious KPIs in competition with each other (i.e. I can do something fast, or I can do something well). Even though almost all organizations state that high Quality is one of their primary goals, it is often the hardest KPI to definitively measure. One of the easiest ways to measure Quality is to perform surveys. The surveys shouldn’t just be of the business users, but should also survey how the different IT groups are interacting with each other.
Compliance
Compliance is the measure of how well an organization is performing according to its own procedures/requirements. Compliance is easiest measured with a good audit. You have policies and procedures. Did you follow them? Invite your internal audit group (or hire an external auditor) to come in and put your organization’s Compliance through the wringer. The first audit gives you a baseline and every subsequent audit will show whether you are moving toward or away from a higher level of Compliance.
Value
Value is all about money. Do we know how much IT services cost? Are the costs being distributed equitably to the service subscribers? Did we meet our budget? Are we spending more this year than last year?
The Problem
Focusing only on one category of KPI will negatively influence your employees’ behavior. Since the four categories of KPIs are in competition with each other, improvement in one category will almost always come at the cost of another (and perhaps multiple other) categories. Let’s look at how focusing exclusively on Performance can influence behavior and negatively affect the other three categories:
Scenario:
IT management requires that the Service Desk answer 10 calls per hour.
Result:
Quality – If you have ever called a Service Desk, and the employee just suggests that you reboot your system and call back if you are still having a problem (without ever doing any real troubleshooting), you are experiencing an organization that has focused on Performance over Quality.
Compliance – Usually there are controls the Service Desk must work within, especially around security. If the Service Desk ignores the controls and does things like resetting passwords without verifying the user’s identity, it will allow the Service Desk personnel to achieve a higher call count (at the cost of security Compliance).
Value – If the Service Desk is enabled to provision software, they can solve many problems by just throwing money at an issue. If the user needs to do screen captures better than the built-in Windows Snipping tool? Give them Camtasia. It includes SnagIt and the Service Desk can start the push, tell the user to reboot in a few minutes, and move on to the next call. Of course Camtasia might be a bit of overkill, but with a sole focus on Performance, the Service Desk personnel are not incented to spend time with the user to find out other (perhaps free*) solutions that might have suited the customer’s needs.
The Solution
You must understand that employees will ALWAYS act in their own best interest. If you measure them only on Performance, then Quality, Compliance, and Value will suffer.
For this reason, you must balance your KPIs across all four quadrants. Some KPIs might even span two categories, but be warned, a KPI that “indirectly” supports another category might not have enough teeth to pass muster when the CIO starts grilling you.
For example, if we enable the Service Desk to answer calls more quickly, that is obviously a Performance KPI, but doesn’t it also indirectly show Value? Not necessarily. What if they simply sit around and surf the internet during the resulting free time? For it to show Value, you would need to baseline the cost/value of the Service Desk and then continue to monitor the cost/value of the Service Desk over time. The bottom line is that if the KPI’s result doesn’t have a dollar sign in it, then it probably isn’t a Value KPI.
Another thing to keep in mind is that is is ineffectual to have more than about a half dozen KPIs. After that there is too much noise and people feel pulled in too many directions. So how can you decide what KPIs to focus on? This is where ITIL’s take on the Deming Continuous Improvement Cycle can help.
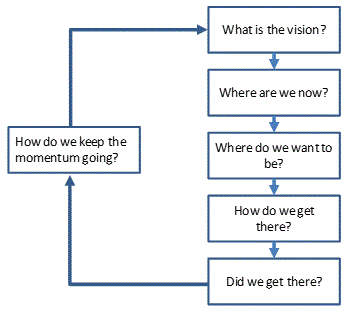
ITIL’s Continuous Improvement Cycle
ITIL’s Continuous Improvement Cycle takes the Deming Cycle, changes up the words a bit, and adds one stage at the beginning and one stage at the end.
Vision Should Drive KPI’s
The first stage – “What is the vision?” – of ITIL’s Continuous Improvement Cycle should drive which quadrant you focus on.
| Sample IT Vision Statements | KPI Quadrant Focus |
| Provide the best customer service | Quality |
| Ensure the highest level availability | Performance |
| Have the least amount of risk exposure | Compliance |
| Deliver the highest rate of return on IT investment | Value |
The next step is to build lists. The first list is “What do you want to measure”. This is the pie-in-sky list of anything that you think would bring value if you had the ability to measure it. Nothing is off limits. It doesn’t matter if you don’t currently capture the data or if the data can’t be reported. Make a list of what you would like to measure/report on.
The next list contains what you can measure and report against. This is a subset of the first list.
The last list is the list of KPIs that you will measure to. It should wind up being somewhere around six items.
With this final list you need to create a new column on the list with the title of Quadrant and start populating that column with Performance, Quality, Compliance or Value. Sometimes you might get lucky and have an entry with both Quality and Compliance in it, but don’t try and force square pegs into round holes**.
So with six KPIs you might have:
- 2 Performance
- 1 Compliance
- 1 Quality
- 1 Value
- 1 that shows both Performance and Value
Or you might have:
- 1 Performance
- 3 Compliance
- 1 Quality
- 1 Value
Most importantly, remember that you will be driving behavior with the KPIs you select!
*By the way, most modern monitor/video card combinations will allow you to physically rotate your 22” display to a portrait orientation. If the only issue is that they can’t use Windows Snipping because the content is scrolling off the bottom of the screen, rotate the monitor. Use Windows Snipping. Rotate the monitor back. Problem solved.
**A good example of a KPI that covers two quadrants would be surrounding a written policy that requires every customer interaction to end with the question of whether there is anything else IT can do to help the user. An audit of practices can show a Compliance metric, and a survey taken before the policy is in effect and then surveys after the policy is active can show a Quality KPI.


Pingback: Costing Issues to Justify Problem Management | ITILtopia
Pingback: Metrics, Key Performance Indicators, and Critical Success Factors | ITILtopia